Tag: visualization
-

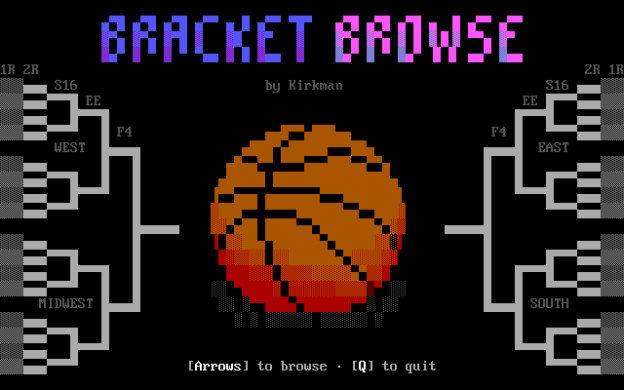
The college basketball bracket … in ANSI
Eleven years ago, when I worked as a designer of news and sports pages at a daily newspaper, I created a system to automate the production of our college basketball brackets in print. One year prior, data journalist Aaron Bycoffe pointed out on Twitter that NCAA.com was using a nice, clean JSON feed to power…
-

Who needs SVG when you’ve got ANSI?
Presidential election years are great times to work at a news organization. As a designer at a newspaper, I love to explore the cool election maps developed by folks at places like the New York Times or the Guardian. My favorite is probably the 2016 Election Forecast from FiveThirtyEight.com, which is full of cool visualizations,…
-

Trade Wars vs. Legend of the Red Dragon: Which was the most popular?
When I was on the Bobby Blackwolf Show in February, we discussed TradeWars 2002 and Legend of the Red Dragon. Early in our back and forth on LoRD, I said: “It became… you know, depending on who you talk to, probably the number one or number two game out of BBSes.” Blackwolf followed up by…
-

Visualizing 314: The directories, the data, and the caveats
This is the final part of a three-part series. In this post I’m going to discuss Fire Escape’s BBS directory formats, the directory parser and the dataset; I’ll also give some caveats about this data.
-

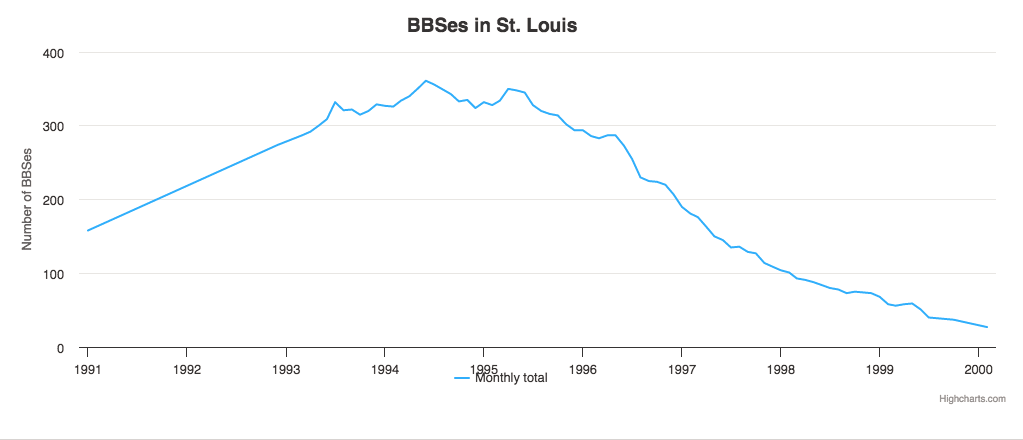
Visualizing 314: The St. Louis scene in charts
This is the second part of a three-part series. It’s chart time! In this post you can explore several graphs that show facets of the St. Louis BBS scene.
-

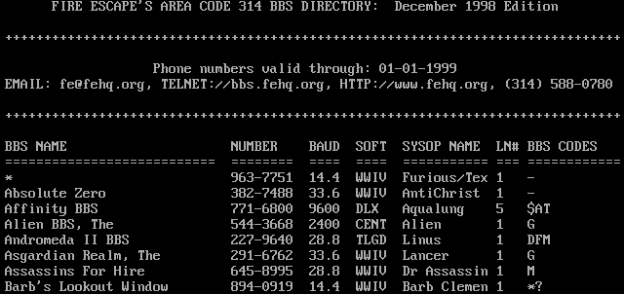
Visualizing 314: Fire Escape’s BBS Directory
This is the first part of a three-part series. If there was a superstar of St. Louis BBSes during the 1990s, it had to be Fire Escape.

